
The Only 3 Indicators You Need (and Why More Hurts)
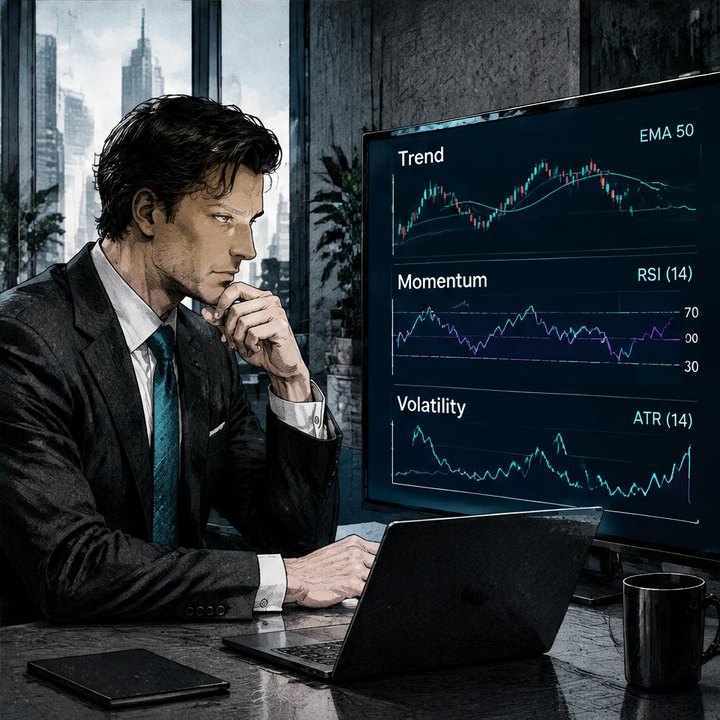
The three indicators worth starting with are a moving average for trend, RSI for momentum, and volume for participation. This minimalist trading framework helps intermediate traders in stocks, forex, crypto, and indices read charts without burying price beneath conflicting signals. Three is a practical limit, not a guarantee of success: the goal is to give each tool a distinct job and make decisions more consistent.
What the three-indicator framework actually means
A useful trading indicators limit is about limiting overlapping information, not enforcing a magic number. Having more than three indicators does not automatically cause failure, but it can encourage analysis paralysis: repeated checking that makes a decision harder rather than better.
The “Holy Trinity” organizes your chart around three questions:
- Trend: Which direction, if any, is the market sustaining?
- Momentum: Is the move strengthening, weakening, or stretched?
- Volume: How much trading activity accompanies the move?
A moving average, RSI, and volume bars provide a straightforward starting setup. They are not the only valid choices. The important distinction is function: three momentum oscillators do not provide three independent perspectives.
Professional traders often favor clean charts because price action remains visible. Indicators should clarify swings, breakouts, and pullbacks—not hide them. Mastering three tools is generally more useful than guessing with ten, especially when you cannot explain what each extra tool changes.
Give trend, momentum, and volume separate jobs
Trend: use a moving average as a directional reference. A rising average with price holding above it supports an upward-trend interpretation. A falling average with price below it supports the opposite. A flat average with frequent crossings suggests a less directional market.
The average is not a guaranteed support or resistance level. Its slope, the surrounding swing structure, and how price behaves around it matter more than a single touch. Shorter lookbacks react faster but tend to produce more changes; longer lookbacks smooth movement but lag more.
Momentum: use RSI to assess the character of a move. RSI measures the balance of recent upward and downward price changes. It can help identify strengthening momentum or a move that appears stretched relative to recent history.
An overbought reading does not automatically mean “sell,” and an oversold reading does not automatically mean “buy.” Strong trends can sustain extreme readings. During an upward trend, RSI cooling during a pullback and recovering with price may be more informative than an isolated extreme.
Volume: use participation to add context. Compare activity with nearby bars and comparable trading sessions. A breakout accompanied by expanding volume suggests broader participation than one occurring on unusually quiet activity.
Volume can support a hypothesis about meaningful participation, including possible institutional involvement. It cannot prove institutional backing, identify traders’ motives, or guarantee that a breakout will hold.
Read the market before reading the indicators
Start with price structure. Is the market making higher highs and higher lows, moving downward, or rotating within a range? Mark obvious swing points and relevant session levels before interpreting indicator readings.
Then apply the tools in order:
- Use the moving average to classify the trend environment.
- Use RSI to assess momentum within that environment.
- Use volume to evaluate participation around the price event you are studying.
This hierarchy resolves apparent disagreement. If the trend is upward but RSI looks stretched, the interpretation need not be “one says buy and one says sell.” It may simply be “upward trend, poor location for chasing.” Waiting becomes a defined response rather than indecision.
Volume also requires instrument-specific care:
- Stocks: Activity changes across the session, and the opening and closing periods deserve context.
- Forex: Spot markets are decentralized. Broker tick volume measures price updates, not total global traded volume.
- Crypto: Volume is specific to the venue or data feed and may differ across exchanges.
- Indices: A cash index is a calculation, not a directly traded security. Related futures or ETFs can provide a participation reference, but they represent different instruments.
Indicators cannot remove these data limitations. Know what your chart actually measures.
A worked example: a breakout followed by a pullback
Consider a hypothetical stock chart. Price has formed higher swing lows beneath the prior day’s high. The moving average slopes upward, RSI has strengthened without price becoming sharply extended, and activity increases as price breaks above that high.
The breakout is an observation, not an automatic entry. A predefined setup might require price to return to the broken level and show that buyers are still defending it.
On the pullback, price remains near the breakout area rather than dropping decisively back into the previous range. RSI cools as the advance pauses. Volume contracts compared with the breakout, which is consistent with reduced activity during the retracement, though it does not establish who is buying or selling.
Next, price turns upward and breaks the pullback’s nearby swing high. RSI recovers, and volume expands relative to the pullback bars. Each tool now answers a different question: the trend remains upward, momentum has resumed, and participation has increased.
Before considering a trade, the plan still needs:
- A clearly defined trigger, such as a completed bar above the pullback swing high.
- An invalidation point tied to price structure.
- Position sizing based on the distance to that invalidation and a predefined risk budget.
- An exit framework that considers nearby resistance, costs, and execution conditions.
If price instead falls back through the breakout area and breaks the relevant swing structure, the setup has changed. A rising moving average should not override that evidence. This is a simple trading strategy framework to test, not a claim of profitability.
Why more hurts—and the mistakes minimalism cannot fix
Indicator clutter adds decision points and can disguise duplicated information. Moving averages, RSI, and many other indicators derive from price. Adding several related calculations may create the appearance of confirmation without adding genuinely different evidence.
Another common mistake is changing settings until the chart explains yesterday perfectly. A setup that looks convincing in hindsight may be fragile in unfamiliar conditions. Choose settings that suit your timeframe and holding period, document them, and test them consistently before making changes.
Minimalism also fails when traders:
- Treat every indicator reading as a trading instruction.
- Switch timeframes until they find a signal that agrees with their bias.
- Ignore spreads, slippage, liquidity, or scheduled announcements.
- Enter without defining what would invalidate the setup.
- Assume three aligned indicators eliminate uncertainty.
Indicators are mathematical summaries, not the underlying market itself. Price and traded activity reflect supply and demand, but no chart reveals every participant’s intentions. Keep indicators secondary to price structure and risk controls. Educational examples are not financial advice.
A short practice checklist for your next chart review
Practice the framework on historical charts without looking ahead, then record simulated decisions:
- Keep one trend tool, one momentum tool, and one volume display.
- State the market structure before reading the indicators.
- Give each tool a written purpose.
- Define the trigger, invalidation, and exit before the outcome is visible.
- Record skipped setups as well as simulated trades.
- Review whether each indicator changed a decision usefully.
If you search “learn trading free,” prioritize structured practice over more signals. The best website to learn trading for your needs should explain limitations and encourage testing; the best trading coach should help you build independent judgment.
Continue with Trade Feeld’s free trading course or Trader Program. For ongoing learning, explore Trade Feeld, @tradefeeld on X, @akylles on X, @tradicators on X, Instagram, YouTube, or LinkedIn. Keep the objective simple: fewer inputs, clearer rules, and decisions you can review.
Frequently asked questions
Sources & further reading
Educational content only, not financial advice. Trading involves risk of loss.
Trade these setups live
Get the same signals our research desk uses — entries, stops, and targets in real time.
Gain instant accessKeep reading
Secret AI Trading Technical Indicators: What Pros Actually Use
Discover if there's such thing as a 'secret' AI indicator and how professional traders actually use machine learning in their technical analysis.
Best Trading Indicators for Gold
Learn which technical indicators work best for trading Gold, focusing on its unique volatility and relationship with the dollar.
Comments(0)
Discuss the article and share your tips.