Learn trading, free.
213 practical guides, in order — from your first trade to fundamental and technical analysis, indicators and professional setups.
Start at step 1 and read in order.
Start here

Start Trading from 0: The Complete First-Week Plan
Learn how to start trading from scratch with this structured 7-day action plan covering platforms, charts, and your first demo trades.

Trading from 0 to Hero: The Realistic Roadmap
Discover the stages of a trader's evolution, from the initial 'unconscious incompetence' to becoming a consistently profitable market participant.

Free Trading Guide for Dummies
A plain-English introduction to the world of trading. Learn the absolute basics of how markets work and how you can participate without the jargon.

Free Trading Guide for Newbies
A fresh look at starting your trading journey in the modern era. Focus on digital tools, community, and the mindset needed for 2026 markets.

Free Trading Guide for Doctors
Efficiency-focused trading for high-earning, time-poor medical professionals. Learn how to manage a portfolio in minutes a day.

Free Trading Guide for Lawyers
Evidence-based trading strategies for legal professionals. Learn how to apply your analytical and research skills to the financial markets.

Free Trading Book for Entrepreneurs
A chapter-by-chapter guide to viewing trading as a scalable business. Learn to manage risk, people (your emotions), and capital like a founder.

Free Trading Strategies for Beginners
Three simple, rule-based trading strategies designed for new traders. Learn how to follow trends and manage risk without complex indicators.

Free Trading Tools for Beginners
A curated list of the best free resources to jumpstart your trading career, from charting software to economic calendars and journals.

Free Trading Guide for Students: How to Build Skills Early
Balancing studies and trading requires discipline. Learn how to treat market education as a long-term academic pursuit without compromising your grades.

Free Trading Guide for Busy Professionals & Engineers
You are already analytical—now apply that rigor to the markets. Learn to trade efficiently around a full-time career using systematic approaches.

Trading with $100: What Is Actually Realistic?
Can you turn a small account into a fortune? We break down the reality of starting with $100, focusing on learning ROI rather than monetary returns.

Paper Trading First: How to Practice Without Losing Money
Paper trading is the most underrated tool for beginners. Learn how to use it effectively to build your skills without risking your hard-earned capital.

Trading vs Investing: Which One Is for You?
The goals, timelines, and mindsets of traders and investors differ drastically. Find out which path aligns with your personality and lifestyle.

Best Website to Learn Trading Free: A Checklist for Success
Searching for the best free trading courses? Use this checklist to filter out hype and find high-quality education that actually helps you learn.

Best Trading Coach & Influencer: How to Choose One You Can Trust
Avoid common traps when choosing a trading mentor. Learn the red flags and the criteria for finding a coach who genuinely supports your development.

Best Trading YouTube, TikTok & Instagram: How to Build a Learning Feed
Social media can be a distraction or an education. Learn how to curate your feed with high-quality content that keeps you focused on growth.

Best Podcast for Trading: How to Learn While You Commute
Turn your commute into a learning session. Discover how to select the best trading and business podcasts that deepen your understanding of the markets.
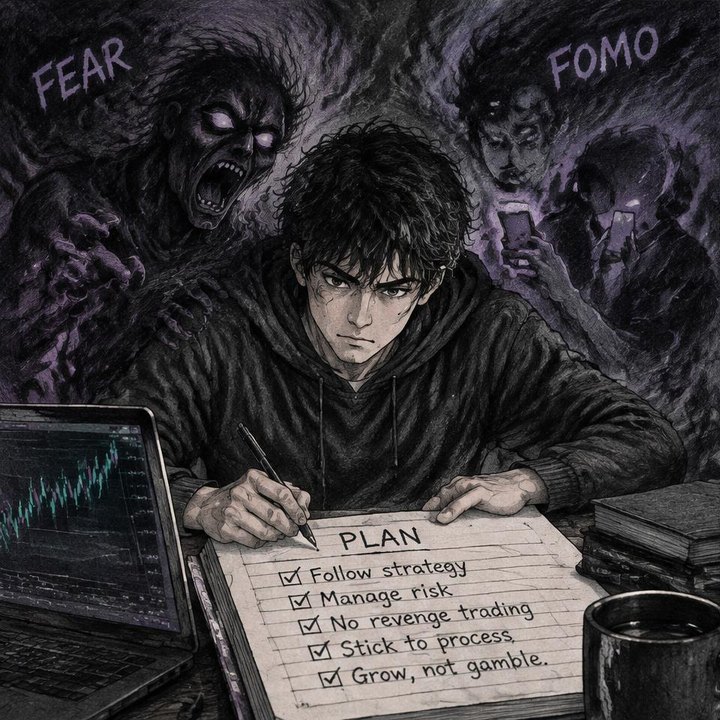
Trading Psychology for Beginners: Fear, FOMO and Discipline
The hardest part of trading is you. Learn how to manage the emotional highs and lows of fear, FOMO, and the need for discipline.

Learn Trading Free: An Honest 90-Day Roadmap
You can Learn Trading Free without falling for guru funnels or Free AI Indicator dumps. Here's a structured 90-day path that builds real skill before you risk real capital.

How Do You Stop Revenge Trading After a Loss?
Learn how to stop revenge trading after a loss with practical cooldown rules, position-sizing checks, and a clear checklist for stocks, forex, and Bitcoin.

How Can You Beat Trading FOMO Without Chasing Prices?
Learn how to manage trading FOMO, stop chasing prices, and build missed trade discipline with clear entry rules, risk limits, and a practical checklist.

How Many Losing Trades Mean You Should Take a Break?
A losing streak needs a process, not a magic number. Learn when to pause trading, review your risk, and rebuild confidence without chasing losses to recover.

Is That Trading Offer a Scam? Red Flags Beginners Miss
Learn the trading scam red flags beginners miss, how to check profit claims and broker identities, and what to do when an offer or withdrawal looks suspicious.

Cash Account or Margin Account: Which Should a Beginner Use?
Learn how cash and margin accounts differ, how settlement works, and why borrowing adds risk, with a practical beginner checklist for stocks, options, and bonds.

Market, Limit, or Stop Order: Which One Should You Use?
Learn when market, limit, stop, and stop-limit orders fit your trading plan, how execution differs, and which risks to check before placing a trade.

How Much Do Trading Fees Really Cost You?
Understand how spreads, commissions, slippage, and holding charges affect trading costs, with a clear break-even example and a practical pre-trade checklist.

When Does Trading Become Gambling? Warning Signs You Should Not Ignore
Learn when trading becomes gambling, spot warning signs across stocks, options, and crypto, and use a practical checklist to pause and seek support.
What you can trade

What Can You Trade? Forex Explained Simply
New to trading? Understanding the markets starts here. We break down the most popular asset classes, focusing on how Forex works for beginners.

Commodities: Trading Gold, Oil, and More
Learn how to trade the building blocks of the global economy: Gold, Oil, and other essential commodities.

Bonds & Debt: The Foundation of Markets
Understand how government and corporate bonds influence interest rates and global market sentiment.

Stocks: Market Basics for Traders
An introduction to the stock market, focusing on indices and how to interpret company growth.

Crypto & Bitcoin: Trading Guide for Beginners
Understand the essentials of the crypto market, from Bitcoin's role to the basics of decentralized finance.

Options & Futures: Trading Explained
Demystifying derivatives: learn how options and futures contracts work for traders.

Alternative Investments: Real Estate, Art, and More
Diversifying beyond traditional stocks and bonds into alternative assets like art, watches, and collectibles.

Why Can an ETF Trade Above or Below Its Holdings' Value?
Learn why ETF prices differ from holdings value, how creation and redemption work, and how to assess premiums, discounts, spreads, and tracking error.

Why Do Leveraged and Inverse ETFs Lose Value in Choppy Markets?
Learn why leveraged and inverse ETFs can lose value in choppy markets, how daily resets drive compounding, and what to check before holding them longer.

Preferred vs Common Stock: What Are You Actually Buying?
Understand what preferred and common shares actually give you, how dividends and voting rights differ, and where bonds fit in a company’s capital structure.

What Is an ADR, and What Risks Come With Foreign Stocks?
Learn how ADRs provide access to foreign stocks, how currency moves affect returns, and which fees, trading frictions, and ownership risks to check.

Crypto Perpetuals vs Dated Futures: What Is the Difference?
Understand how crypto perpetuals and dated futures differ in funding, expiry, settlement and basis, with a worked example and practical trading checks.

TIPS vs Treasuries: Which Risks Does Inflation Protection Leave Behind?
TIPS protect against measured inflation, not every bond risk. Learn how real yields, duration, taxes and purchase price affect comparisons with Treasuries.

Brent vs WTI: Why Are There Two Major Oil Prices?
Learn why Brent and WTI have different prices, how delivery locations shape their spread, and what to check before comparing oil quotes on a screen.
The economy (GUI)
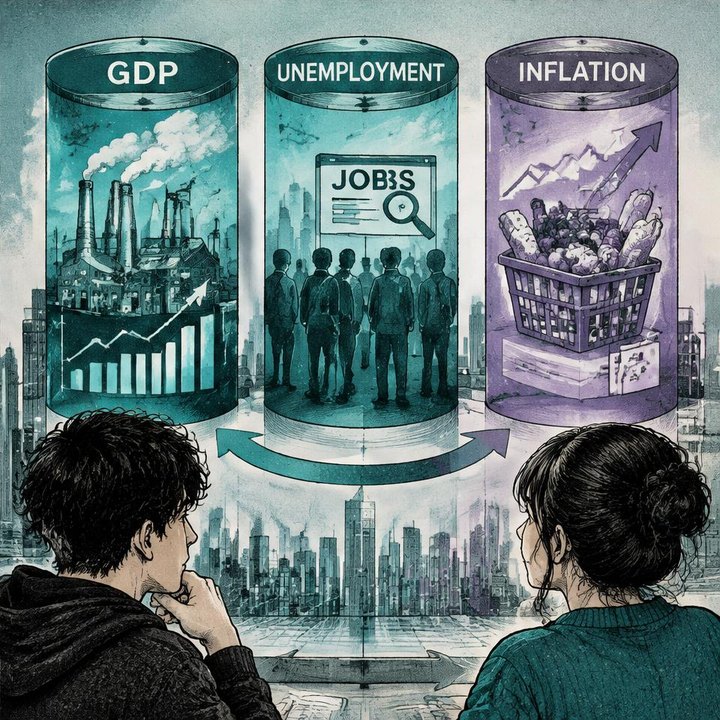
The GUI Concept: GDP, Unemployment & Inflation
Trade Feeld's GUI framework is the simple way to categorize the complex world of the economy.

GDP Explained for Traders
How Gross Domestic Product (GDP) reports influence market direction and economic sentiment.

Unemployment & NFP Explained
Demystifying the most anticipated economic report: the Non-Farm Payroll (NFP) and unemployment rates.

Inflation & CPI Explained
What is inflation? Learn how the Consumer Price Index (CPI) tracks it and why it dominates today's trading landscape.

How GUI Data Moves Gold, Indices, Forex & Bitcoin
Connect the dots: how GDP, Unemployment, and Inflation reports actually influence your favorite instruments.

PCE vs CPI: Why Does the Fed Prefer a Different Inflation Gauge?
Learn why the Fed prefers PCE over CPI, how their weights differ, and how to interpret inflation releases across bonds, forex, and stock indices.

What Does PMI Above or Below 50 Actually Tell Traders?
Learn what PMI above or below 50 means, how traders read new orders and inflation signals, and why indices, forex and bonds can react differently.

Why Can Strong Retail Sales Hide a Weak Consumer?
Strong retail sales can mask inflation, uneven spending and household strain. Learn to read the control group, revisions and the wider consumer picture.

How Do Bank Lending Standards Signal a Turning Credit Cycle?
Learn how bank lending standards reveal shifts in the credit cycle, how to interpret loan surveys, and what those changes mean for bonds and stocks.

QE vs QT: How Does the Fed's Balance Sheet Affect Markets?
Learn how QE and QT change the Fed’s balance sheet, influence bonds, forex and indices, and why liquidity alone cannot explain every move across markets.

What Makes a Treasury Auction Weak or Strong?
Learn how auction tails, bid-to-cover ratios and bidder allocations reveal Treasury demand—and why context matters for bonds, forex and gold traders.

Why Does Economic Data Get Revised After Markets Already React?
Learn why economic data gets revised, how updates affect the market story, and where to check jobs, inflation and GDP releases before drawing conclusions.
Micro & Macro

Microeconomics for Traders: Supply, Demand, and Pricing Power
Understand how individual market forces like supply, demand, and corporate pricing power drive asset price movements.

Macroeconomics for Traders: Central Banks, Rates, and Cycles
Learn how the big picture—central bank policy, interest rates, and economic cycles—dictates the direction of the global markets.

Interest Rates & the Fed: Why Every Market Watches Them
Learn why federal interest rate decisions are the most important events for traders and how they influence global asset prices.

Micro vs Macro: How to Use Both in One Trade Idea
Learn how to combine top-down macro analysis with bottom-up micro research to build a robust, high-conviction trading thesis.

Why Do Higher Oil Prices Help Some Countries and Hurt Others?
Explore how higher oil prices redistribute income across countries, move currencies, shape inflation, and affect company margins without a simple rule.

How Does a Strong Dollar Change Multinational Earnings?
Learn how a stronger dollar affects multinational revenue, margins, and earnings, and how to separate currency translation from underlying business growth.

Does Rising Pay Always Hurt Company Profits?
Rising wages do not automatically squeeze profits. Learn how productivity, pricing power, labor exposure, and demand shape company margins and stocks.

How Can Inventory Restocking Create a Misleading Growth Surge?
Inventory restocking can lift orders, earnings and GDP without stronger final demand. Learn how to separate a temporary rebound from durable growth.

Why Do Higher Rates Hit Some Companies Years Later?
Higher rates can take years to squeeze company profits. Learn how debt maturities, refinancing costs and cash buffers shape the delayed earnings hit.

Which Sectors Benefit First From Higher Government Spending?
Learn which sectors can benefit first from government spending, how contracts reach earnings, and why bonds and financing costs can change the picture.

Why Can Mining and Energy Stocks Move More Than Commodity Prices?
Learn why gold miners and oil producers can move more than commodities, and how costs, debt, hedges and valuation shape their stock-price sensitivity.
Your trading desk

How to Set Up Your Trading Desk (Monitors, Hardware, Layout)
Learn how to build a professional trading desk setup that minimizes fatigue, maximizes focus, and helps you execute trades quickly.

TradingView and 4 Other Charting Tools Compared
Compare the most popular charting platforms to find the best fit for your trading style and technical analysis needs.

How to Choose a Broker (Regulation, Fees, Platforms)
Learn the essential criteria for selecting a reliable, regulated broker to ensure your capital is safe and your trading costs are low.

Your Trading Journal: Template and Habits
Discover the critical habit of trading journaling and get a simple, effective template to track your performance and improve your consistency.

Build a News & Calendar Feed (Economic Calendar, Earnings)
Learn how to build a custom news and calendar feed to stay informed without getting overwhelmed by market noise.

How Do You Set Trading Alerts Without Watching Charts All Day?
Learn to set useful trading alerts for stocks, forex and crypto, filter out noise, and build a simple review routine without watching charts all day long.

How Do You Build a Stock Screener That Filters Out Untradable Names?
Build a stock screener around dollar volume, spreads, depth, and relative volume to remove names that look active but are difficult to trade efficiently.

Is Your Chart Delayed? How to Check Market Data Before Trading
Learn how to spot delayed quotes, verify timestamps and exchange coverage, and check stock, index, and options data before using a chart to place a trade.

How Can You Protect Your Trading Account From Takeovers?
Protect your trading account with stronger logins, safer API permissions, withdrawal controls, and a clear response plan for suspicious activity.

What Should You Do If Your Platform Goes Down During a Trade?
Build a practical outage plan for stocks, forex, and options: verify orders, contact your broker, and avoid duplicate trades when your platform goes down.

How Do You Calculate Trading Expectancy in a Spreadsheet?
Build a trading expectancy spreadsheet, calculate net results and R multiples, and use a practical dashboard to evaluate a strategy without overclaiming.

Is Bad Historical Data Ruining Your Strategy Tests?
Bad data can distort a backtest before your strategy gets a fair test. Learn how to audit missing candles, stock splits, timestamps, and execution assumptions.
Fundamental analysis

How Companies Actually Make Money: The Core of Fundamental Analysis
Understanding the primary revenue models and cost structures that drive corporate profitability is the first step in fundamental analysis.

What Are Financial Statements? A Beginner's Guide to Corporate Data
Financial statements are the official records of a company's financial activities, providing a snapshot of its health and performance.

How to Read a Balance Sheet: Assets, Liabilities, and Equity
The balance sheet provides a snapshot of a company's financial health by listing everything it owns and everything it owes.

How to Read an Income Statement: The Story of Profitability
The income statement tracks a company's revenue and expenses over time, showing exactly how much profit it is making.

How to Read a Cash Flow Statement: Following the Money
Profit is an opinion, but cash is a fact. Learn how the cash flow statement reveals the true liquidity of a business.

Key Financial Ratios Every Trader Should Know
Financial ratios allow you to compare companies of different sizes and across different industries on an even playing field.

How to Read Economic News Without Getting Faked Out
The market often reacts to news in counter-intuitive ways. Learn how to distinguish between 'noise' and market-moving data.

Earnings Season Playbook: How to Trade Corporate Reports
Earnings season is the most volatile time for stock traders. Learn how to navigate the risks and rewards of quarterly reports.

CPI Day Playbook: Trading the Inflation Report
The Consumer Price Index (CPI) has become one of the most important days for modern traders. Learn how to navigate the inflation data.
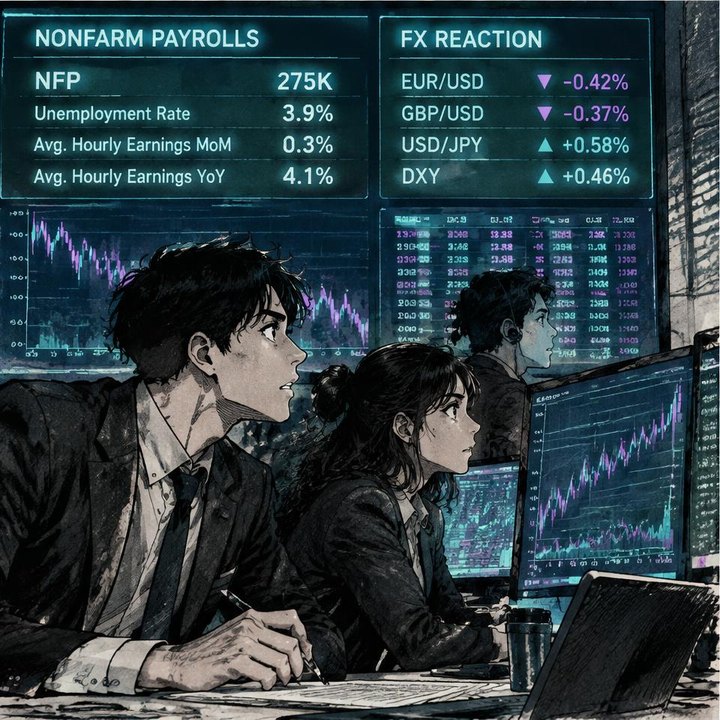
NFP Day Playbook: Trading the Jobs Report
Non-Farm Payrolls (NFP) is the king of economic indicators. Learn how the employment data drives the global markets.

FOMC Day Playbook: Central Banks and Interest Rates
The Federal Open Market Committee (FOMC) determines the cost of money. Learn how to trade the most important meetings in finance.

Economic Moats: Spotting Durable Companies
A moat is a structural advantage that protects a company's profits from competitors. Learn the four types of moats.
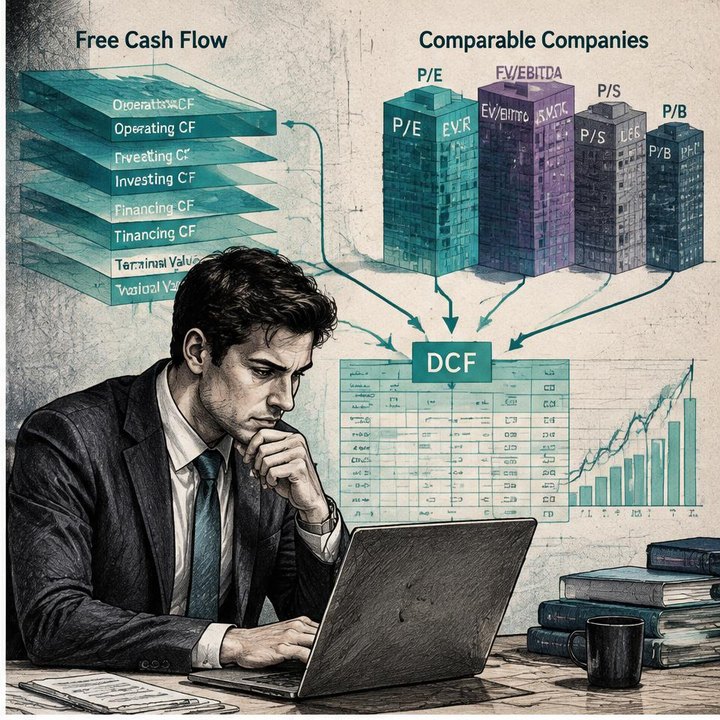
Valuation Basics: DCF and Multiples Made Simple
Knowing what a company is worth is different from knowing its price. Learn the basics of DCF and Multiples valuation.

Guidance, Buybacks & Dividends: The Other Fundamental Signals
Earnings aren't the only signal management sends to the market. Learn how to read guidance, buybacks, and dividend changes.

Is Stock-Based Compensation Hiding the True Cost of Growth?
Stock-based compensation can flatter cash flow while diluting shareholders. Learn to assess its real cost, share-count trends, and owner earnings.

GAAP vs Adjusted Earnings: Which Add-Backs Should Worry You?
Learn how to compare GAAP and adjusted earnings, spot questionable add-backs, and test whether reported profit reflects the economics of a stock.

Can Revenue Grow While a Business Gets Weaker?
Revenue growth can hide weaker cash collection, shrinking margins, and stretched customer terms. Learn how to test the quality behind rising sales.

Why Does High ROIC Matter More Than Fast Growth Alone?
Learn why high ROIC can matter more than rapid growth, how to compare returns with capital costs, and how to spot expansion that destroys economic value.

How Do You Analyze a Bank Stock Without Using the Wrong Metrics?
Learn bank stock analysis through margins, deposit costs, credit quality, capital and valuation—and avoid metrics that obscure how banks really work.

Which SaaS Metrics Reveal Growth That Can Actually Last?
Learn how retention, acquisition costs, cohort economics, and gross margins help reveal whether a SaaS company's growth has the foundations to last.

Does Insider Buying Really Signal That a Stock Is Cheap?
Insider buying can reveal confidence, but not necessarily value. Learn to read Form 4 filings, assess purchase patterns, and test the valuation case.
Technical analysis

What Is Technical Analysis? A Beginner's Guide to Price Action
Technical analysis is the study of historical price action to forecast future market movements based on patterns, trends, and volume.

How to Read a Candlestick Chart: The Ultimate Guide
Master the art of reading candlestick charts to understand market sentiment and time your trades with precision.

Support and Resistance Made Simple: Finding the Market's Floor and Ceiling
Learn how to identify and draw support and resistance zones to find high-probability entry and exit points.

Trends, Trendlines & Market Structure: How to Read the Market's Direction
Understand market structure and trendlines to align your trades with the dominant flow of money.

Volume: The Truth Behind Price Action
Learn how to use volume to confirm price moves and spot hidden market reversals before they happen.

Timeframes: Which One Should You Trade?
Select the right timeframe for your strategy; higher timeframes show the big picture, while lower timeframes reveal entry timing.

Chart Patterns That Still Work (Flags, Triangles, Head & Shoulders)
Classic chart patterns like flags, triangles, and head-and-shoulders help predict potential future moves based on historical price behavior.

Candlestick Patterns Cheat Sheet
Master common candlestick reversal and continuation patterns to improve your market entries and exits.

Gaps, Ranges and Breakouts
Gaps, ranges, and breakouts are high-probability setups that occur when market structure shifts from consolidation to trend.

Building a Top-Down Chart Routine
A consistent top-down chart routine is the secret to professional trading, helping you eliminate impulsive decisions and focus on high-probability setups.

Multi-Timeframe Confluence: How Pro Traders Filter Noise
A practical breakdown of how higher-timeframe bias, mid-timeframe structure, and execution-timeframe triggers stack to produce high-probability setups.

Log vs Linear Charts: Are You Reading Long-Term Trends Wrong?
Learn how log and linear charts change your view of stocks, Bitcoin and indices, and choose the right scale to compare long-term trends without distortion.

Can Market Breadth Reveal Weakness Before an Index Falls?
Market breadth can expose weak participation beneath a strong index. Learn how to assess divergences, compare indicators, and avoid false signals.

How Do Relative Strength Charts Find Leaders Before Price Breakouts?
Relative strength charts reveal stocks outperforming a benchmark before price breaks resistance. Learn to compare leaders, sectors, and signals clearly.

Do Point-and-Figure Charts Filter Noise Better Than Candlesticks?
Learn how point-and-figure charts filter small price moves, how settings change the picture, and when candlesticks provide essential trading context.

Why Can Heikin-Ashi Charts Make Trade Entries Look Better Than They Are?
Heikin-Ashi candles smooth trends but can hide execution gaps. Learn how to check actual prices, test signals, and avoid misleading trade entries.

Are Renko Backtests Too Good to Be True?
Renko backtests can look cleaner than real trading. Learn how brick construction, price paths, and execution assumptions affect their reliability.

Is That Price Gap Real or Just a Dividend or Stock Split?
Learn how dividends and stock splits affect chart gaps, compare adjusted prices, and check corporate actions before interpreting a stock’s move.
Indicators

Secret AI Trading Technical Indicators: What Pros Actually Use
Discover if there's such thing as a 'secret' AI indicator and how professional traders actually use machine learning in their technical analysis.

Best Trading Indicators for Gold
Learn which technical indicators work best for trading Gold, focusing on its unique volatility and relationship with the dollar.

Best Trading Indicators for Oil
Crude oil is highly volatile. Here are the most effective indicators to manage risk and catch trends in the oil market.

Best Trading Indicators for Bitcoin
Bitcoin requires unique analysis. See which indicators help you navigate the 24/7 crypto market volatility.

Best Trading Indicators for Crypto & Altcoins
Altcoins are even more volatile than Bitcoin. Learn which indicators help filter the noise in these speculative markets.

Best Trading Indicators for Indices (NQ, S&P 500, US30)
Trading major indices like the NQ and S&P 500 requires precise tools. Discover the best indicators for institutional market flow.

Best Trading Indicators for Forex
Navigating the Forex market requires clear focus. Here are the best indicators for identifying trends and managing your currency trades.

Best Indicators for Options Traders (IV, IV rank, expected move)
Options trading is different. Learn the essential metrics like Implied Volatility and Expected Move that pros use.

Best Trading Indicators for Beginners
Starting to trade? Discover the best trading indicators that help you learn price action without overwhelming your screen.

The Only 3 Indicators You Need (and Why More Hurts)
Most traders fail because they clutter their charts. Learn why using just three indicators is the key to clarity and professional success.

RSI Settings Pros Use (and Why 14 Isn't Magic)
Most traders stick to the default 14-period RSI, but experienced market participants often tune it to better fit their specific asset class.

MACD Explained: The Crossover Most Traders Misread
The MACD crossover is a staple of technical analysis, yet it is frequently misinterpreted. Learn how to read the signals correctly to avoid common traps.

VWAP Secrets Day Traders Rely On
Volume Weighted Average Price (VWAP) is the ultimate intraday indicator. Learn how institutional traders use it to gauge value and find entry points.
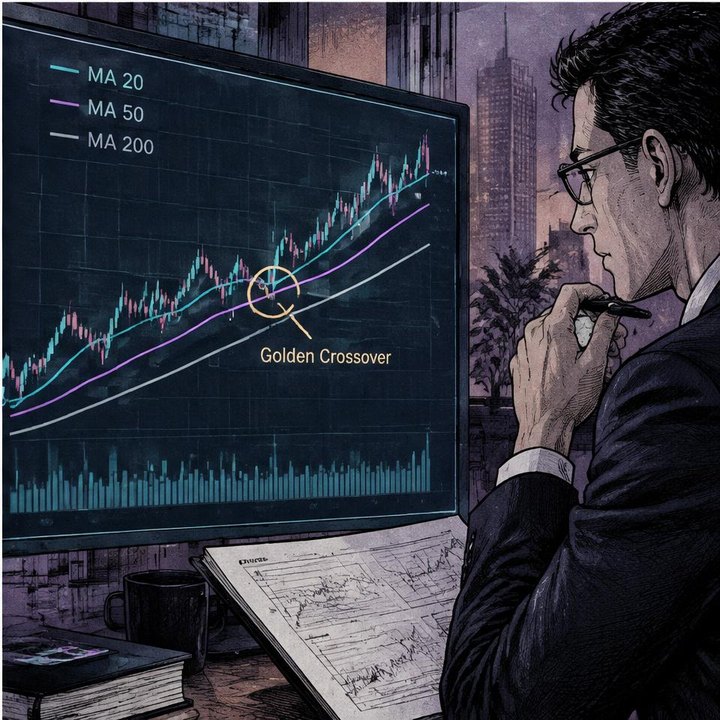
Moving Averages: 20, 50, 200 and the Golden Cross
Moving averages are the foundation of trend analysis. We explain how the 20, 50, and 200-day averages work and what the 'Golden Cross' actually signals.

Bollinger Bands: Squeezes and Fake Breakouts
Bollinger Bands measure volatility and identify overextended conditions. Learn to spot the 'squeeze' and avoid common false breakouts.

ATR: The Indicator That Sets Your Stop Loss
Stop wasting money by using fixed-pip stop losses. The Average True Range (ATR) helps you set stops based on actual market volatility.

Fibonacci Retracements: Useful or Voodoo?
Are Fibonacci levels magic or just self-fulfilling prophecies? Learn the right way to draw them and when they actually matter.

Volume Profile & Market Profile Simplified
Stop looking at time and start looking at volume. Learn how Volume Profile reveals where the real battle between buyers and sellers is taking place.

Stochastic & Momentum Oscillators
Stochastic oscillators help pinpoint potential reversals by comparing closing prices to a range over time. We break down how to read them correctly.

Ichimoku Cloud in 10 Minutes
The Ichimoku Cloud looks intimidating, but it is a powerful all-in-one indicator. Master the basics of the Kumo cloud in under 10 minutes.

AI Indicators vs Traditional Indicators: What Actually Changes
RSI and MACD told you what already happened. AI indicators tell you what is statistically likely to happen next. Here's the honest difference — and where the hype falls apart.

AI Trading Robot: A Realistic Guide to Automated Execution
Most AI Trading Robot pitches are fantasy. Here's what automated execution actually does well, where AI Bots fail, and how to evaluate a system before you connect an API key.

Can ADX Tell You When a Forex Trend Is Worth Trading?
Learn how ADX measures forex trend strength, what rising and falling readings mean, and how to combine it with price structure, execution, and risk checks.

Do Donchian Channels Help Filter Bitcoin Breakout Noise?
Learn how Donchian channels can clarify Bitcoin breakouts, where false signals arise, and how lookback settings, execution rules, and risk checks matter.

How Can Keltner Channels Separate Oil Trends From Overextension?
Learn how Keltner Channels help distinguish sustained oil trends from stretched moves using channel slope, volatility, pullbacks, and market context.

Can the Choppiness Index Keep You Out of Sideways S&P 500 Trades?
Learn how the Choppiness Index can filter sideways S&P 500 conditions, how to choose settings, and why price structure still matters before a trade.

How Do You Use CCI on Gold Without Fading Every Strong Move?
Learn how to use CCI on gold to separate trend strength from exhaustion, evaluate pullbacks, and avoid treating every overbought reading as a sell signal.

Does the Money Flow Index Spot Stock Buying Pressure Before RSI?
Can MFI reveal stock buying pressure before RSI? Learn how volume changes momentum signals, compare divergences, and build a practical analysis checklist.

IV Rank vs IV Percentile: Which Better Describes Options Pricing?
Understand how IV rank and IV percentile describe options pricing, why outliers matter, and how to use both without confusing context with value.
Strategies & setups

Breakout Trading Strategy Step by Step
Breakout trading is the art of capturing big momentum as price clears key resistance levels. Learn the exact criteria for a high-probability breakout.

Pullback Strategy: Buying Dips the Right Way
Learn how to enter a trend at a discount by identifying high-probability pullback zones.

Opening Range Breakout for Indices
The ORB strategy is a classic for index traders. Capture the volatility of the first 30 minutes.

Swing Trading Setups for Busy People
How to trade effectively if you only have an hour a day. Focus on quality, not quantity.

Trend-Following System Blueprint
The most robust way to trade: identifying trends and riding them to completion.

Mean Reversion Setups
Capitalize on market overextension. When everything is too far from the average, it's time to bet on the return.

Gold Trading Strategy for London & New York Sessions
Gold is highly reactive during session overlaps. Learn how to trade the volatility.

Bitcoin Trading Strategy: Weekend, Funding & Levels
Bitcoin never sleeps, but its behavior changes. Learn how to trade the funding and weekend gaps.

Options Income Strategies: Covered Calls & Cash-Secured Puts
Generate consistent income from your stock portfolio using options.
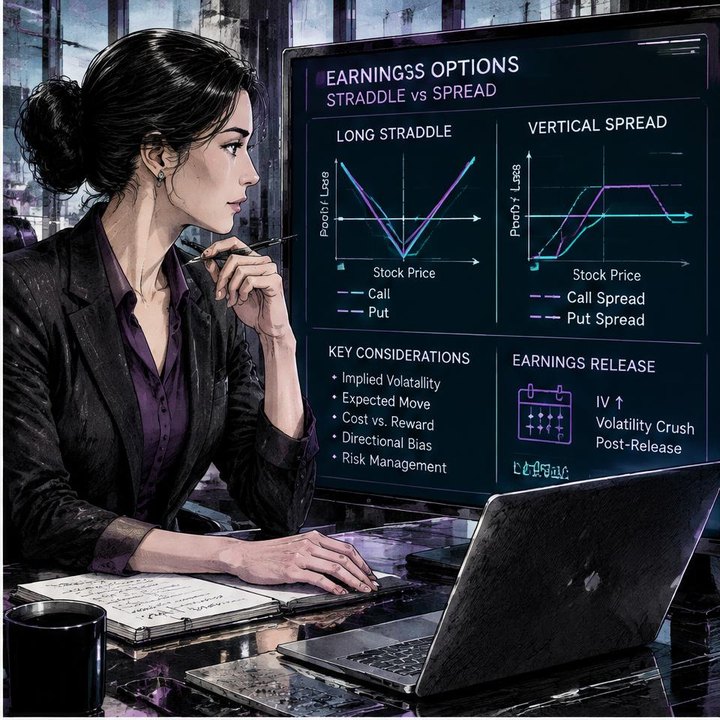
Earnings Options Setups: Straddles vs Spreads
How to trade the 'Earnings Volatility Crush' using options.

Risk Framework: The 1% Rule, R-Multiples & Drawdown Limits
The most important article you will read. How to manage risk so you stay in the game.

Build Your Own Trading Plan (One-Page Template)
The ultimate guide to writing a simple, actionable, and repeatable trading plan.

Position Sizing for Volatile Markets: The 1R Framework
Most blown accounts are sizing problems, not strategy problems. Here's the volatility-adjusted 1R framework we use to keep drawdowns capped through any regime.

Reading Liquidity Sweeps: Where Stops Actually Live
Liquidity sweeps look like fakeouts to retail and look like fills to institutions. Here's how to identify them in real time and trade the reversal.

AI Robotics in Markets: When Bot Trading Meets Microstructure
AI Robotics isn't just warehouses and self-driving cars. The same principles — perception, planning, control — power modern Bot Trading. Here's the mapping that actually matters.

How Does Pairs Trading Work When Both Stocks Fall?
Learn how pairs trading works when both stocks fall, with a clear example of relative returns, hedge sizing, borrowing costs, and practical risk checks.

Can a Monthly Momentum Rule Reduce Trading Decisions?
A monthly momentum rule can simplify decisions across indices, bonds, and gold. Learn how signals, execution timing, and trading costs shape the process.

Can You Trade Post-Earnings Drift After the Initial Move Is Over?
Learn how to assess post-earnings drift after the first move, distinguish continuation from chasing, and account for execution costs and event risk.

Why Does a Takeover Target Trade Below the Offer Price?
Learn why takeover targets trade below cash offers, how deal risk shapes the spread, and why annualized merger returns can mislead stock traders.

Can Forex Carry Income Survive a Sharp Currency Drop?
Forex carry income can cushion a currency decline, but sharp losses, changing rollover rates and leverage can overwhelm it. Learn how to assess the risk.

Protective Put or Collar: What Does Portfolio Insurance Really Cost?
Compare protective puts and collars, including premium costs, capped upside, expiration risks, and a practical checklist for understanding portfolio insurance.

How Do You Test a Strategy Without Overfitting the Past?
Test trading strategies with clean data, realistic costs, and unseen samples. Learn how walk-forward testing helps expose overfitting before risking money.

Are Five Small Trades Really One Big Bet? How to Cap Portfolio Heat
Five small trades can hide one large exposure. Learn to measure portfolio heat, spot correlated risks, and build practical limits before adding positions.
Advanced & hot topics

Is There an AI Trading Bubble? Will It Burst or Crash?
Is AI a bubble, and will AI trading crash? The case for and against, AI bubble risks, when a bubble could burst, and what happens to portfolios if it does.

Will the FOMC Raise Interest Rates at the Next Meeting? The Case For and Against
Assess the case for and against a Fed rate hike, read futures probabilities, and build defined-risk scenarios for bonds, forex and indices before the FOMC.

Will NVIDIA Go Up or Crash After Earnings? How to Read the Setup
Learn how to assess NVIDIA’s earnings setup using expectations, valuation, guidance, implied moves and defined-risk scenarios—without predicting prices.

Will Bitcoin Hit a New All-Time High?
Explore the signals behind a potential Bitcoin new all-time high, from liquidity and spot demand to leverage, invalidation, and defined-risk planning.

Is a Recession Coming?
Is a recession coming? Weigh the evidence for and against, track key economic signals, and learn how traders can frame scenarios with defined risk.

Will Gold Keep Rising?
Will gold keep rising? Examine real yields, the dollar, central-bank demand and positioning, then build scenarios with defined risk instead of forecasts.

How Markets React to CPI
Learn how CPI surprises move indices, bonds, forex and gold, why positioning can reverse the first reaction, and how traders define risk around releases.

Will Tesla Rally After Earnings? The Case For and Against
Explore the Tesla earnings outlook, bull and bear signals, automotive margins, and defined-risk ways to assess TSLA stock and options around earnings.

Can Apple Earnings Justify a Higher Stock Price? For and Against
Explore the Apple earnings outlook, the AAPL bull bear case, and practical ways to assess valuation, business signals, and defined-risk options strategies.

Will OPEC Cuts Push Oil Higher? Arguments For and Against
Explore the bullish and bearish cases for OPEC cuts, the signals that confirm tighter oil supply, and ways to structure oil trades with clearly defined risk.

Will the US Dollar Keep Strengthening? The Case For and Against
Explore the US dollar outlook through rate spreads, growth, safe-haven flows and positioning, with practical signals and defined-risk forex and gold frameworks.

Could a Yen Carry Trade Unwind Crash Markets? For and Against
Explore how a yen carry trade unwind can spread across forex, indices and bonds, what limits crash risk, and which signals reveal growing funding stress.

Is a Stock Market Crash Near? The Evidence For and Against
Assess stock market crash risk through valuations, credit, earnings and volatility, then build defined-risk scenarios without pretending to predict a crash.

Is Magnificent 7 Concentration Dangerous? Arguments For and Against
Explore the arguments for and against Magnificent 7 concentration, the signals that matter, and practical ways to define risk in stocks and indices.

Do Bitcoin ETF Inflows Predict Higher Prices? For and Against
Do Bitcoin ETF inflows signal higher prices? Weigh demand, arbitrage, timing and macro risks, then build a framework for testing flows with defined risk.

Will Rate Cuts Restart the Housing Boom? The Case For and Against
Explore how Fed rate cuts affect housing demand, mortgage costs, homebuilder stocks and bonds—and which signals distinguish a recovery from a false start.

Will US Debt Trigger a Bond Yield Crisis? Arguments For and Against
Can US debt spark a bond yield crisis? Explore both sides, the signals that matter, and defined-risk frameworks for trading bonds, forex and gold.

Will Tariffs Fuel Inflation and Hurt Stocks? For and Against
Explore how tariffs can lift inflation and pressure stocks, why those effects may fade, and which signals traders can monitor across major asset classes.

Can China Stimulus Spark a Global Rally? The Case For and Against
Can China stimulus lift global markets? Explore the bullish and bearish cases, credit signals, cross-asset effects, and ways to define trading risk.

Will Ethereum ETFs Drive a Lasting Rally? For and Against
Explore the Ethereum ETF bull and bear case, the flow and staking signals that matter, and practical ways to structure ETH exposure with defined risk.

Does the Bitcoin Halving Still Predict Bull Markets? For and Against
Does Bitcoin’s halving still signal a bull market? Weigh the supply argument against demand, liquidity and a small sample, then build a defined-risk plan.

Should You Buy the S&P 500 at Record Highs? For and Against
Should you buy the S&P 500 at record highs? Weigh earnings, valuation, market breadth and policy signals, then build a trading plan with defined risk.

Could Weaker Fed Independence Shake Markets? For and Against
Explore how weaker Fed independence could affect bonds, forex, gold and indices, with competing arguments, key signals and a defined-risk framework.

Will AI Capex Pay Off for Big Tech? The Case For and Against
Explore the case for and against Big Tech’s AI spending, the evidence that matters, and practical ways to assess earnings risk and trade with defined risk.

Can a Meme Stock Rally Last? Arguments For and Against
Can a meme stock rally endure? Explore the bull and bear cases, dilution risks, flow signals, and defined-risk frameworks for evaluating stocks and options.

Is Bitcoin a Better Hedge Than Gold? Arguments For and Against
Compare Bitcoin and gold as hedges against inflation, market stress and currency risk, with practical evidence checks and defined-risk trading frameworks.

Are 0DTE Options Making Markets More Fragile? For and Against
Do 0DTE options destabilize markets? Examine dealer hedging, competing evidence, warning signals, and defined-risk approaches to intraday options.

Could Private Credit Trigger the Next Crisis? For and Against
Could private credit trigger a crisis? Explore contagion channels, valuation blind spots, loss buffers, and signals that matter for bond and stock traders.

Is De-Dollarization a Real Threat to Markets? For and Against
Explore the case for and against de-dollarization, its effects on forex, bonds and gold, and the signals that separate structural change from market noise.

Will Small Caps Outperform Mega Caps? The Case For and Against
Explore the case for and against small-cap leadership, the signals that confirm a rotation, and practical ways to manage risk versus mega-cap exposure.

Could Commercial Real Estate Losses Spark Another Banking Shock? For and Against
Could commercial property losses trigger bank stress? Explore both sides, the signals to monitor, and defined-risk frameworks for stocks and bonds.

Is Passive Investing Distorting Stock Prices? Arguments For and Against
Does passive investing distort stock prices? Explore the competing arguments, index-flow signals, and defined-risk frameworks for stocks and indices.

Will GE Aerospace Stock Go Up After Earnings on October 20?
Explore the bull and bear cases for GE Aerospace earnings, the data that could change the outlook, and ways to manage event risk without predicting prices.

Will the US Dollar Keep Rising After Four Straight Weeks of Gains?
Four weeks of dollar gains raise a key question: what comes next? Learn how yields, Fed expectations and risk management shape both sides of the dollar debate.

Will Tech Stocks Keep Recovering Despite AI Profit Concerns?
Explore both sides of the tech stock recovery, how AI profit concerns affect valuations, and what traders can monitor while keeping risk clearly defined.

Will TSM Stock Go Up After Earnings on October 15?
Will TSM rise after earnings on October 15? Explore the bullish and bearish cases, what to verify, and how to manage event risk without predicting prices.

Should I Buy ASML Stock Before Earnings on October 14?
Weigh the case for and against buying ASML before earnings, what to check in its outlook, and how to manage event risk without predicting the stock price.

Will Bank of America Stock Go Up After Earnings on October 14?
Will Bank of America stock rise after earnings? Learn what could support or weaken BAC, which figures to verify, and how to manage earnings-event risk.

Which Stocks Could Benefit From the US-China Tariff Cuts?
Explore which stocks could benefit from US-China tariff cuts, what could limit the gains, and how to evaluate trade-sensitive companies with defined risk.

Will the Fed Raise Rates in October After the Weak Jobs Report?
A weak jobs report has cooled October Fed rate-hike expectations. Learn both sides of the debate, what data matters next, and how to manage trading risk.

Is JPMorgan Stock a Buy Before Earnings on October 13?
Is JPMorgan stock a buy before October 13 earnings? Weigh valuation, guidance, credit risks and defined-risk approaches before making an earnings trade.

Should I Buy Goldman Sachs Stock Before Earnings?
Considering Goldman Sachs before earnings? Learn the bull and bear cases, what to verify, and how to manage event risk without betting on a price forecast.

Will PepsiCo Stock Go Up After Earnings on October 8?
Will PepsiCo stock rise after October 8 earnings? Learn how to assess revenue, guidance, expectations, and defined-risk trades without predicting the move.

How Would a US Diesel Export Ban Affect Oil Prices?
A US diesel export ban could ease domestic fuel pressure but disrupt global supply. Learn the competing effects on crude, refining margins, and trading risk.

Will DeepSeek's Huawei AI Chip Software Hurt Nvidia Stock?
DeepSeek's Huawei chip software raises questions for Nvidia. Learn both sides, what evidence matters, and how traders can manage risk without guessing.