
Volume Profile & Market Profile Simplified
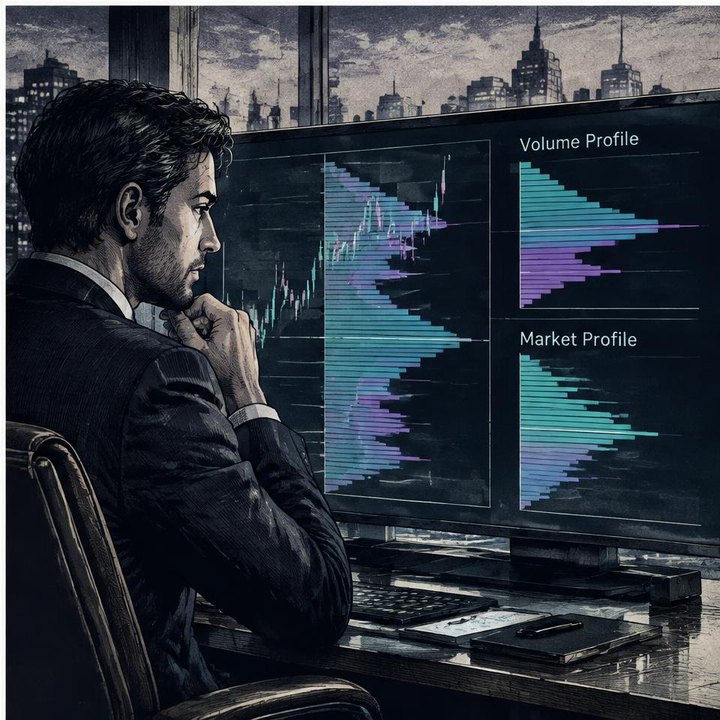
Volume Profile and Market Profile simplify a busy chart by showing where trading activity concentrates across prices. Volume Profile measures traded volume at each price; Market Profile usually measures how often price appears across time intervals. For intermediate traders studying stocks and indices, these tools help identify accepted value, potential support and resistance, and areas where price may move quickly—without pretending to predict the next move.
What Volume Profile and Market Profile actually show
Traditional charts plot price over time, while standard volume bars show how much traded during each candle. Volume Profile rearranges that information into a horizontal histogram: longer bars mean more shares or contracts traded at that price.
Its main reference points are:
- Point of Control (POC): The price level, or grouped price row, with the most traded volume in the selected period.
- Value Area (VA): The range containing a chosen majority of volume, commonly 70%. Its boundaries are the value area high and value area low.
- High Volume Nodes (HVNs): Bulges where substantial trading occurred. They often mark areas of acceptance and can become support or resistance zones.
- Low Volume Nodes (LVNs): Thin areas where relatively little trading occurred. Price may travel through them quickly or reject them sharply.
The POC is often described as the market’s “fairest” price. More precisely, it is the busiest price in that sample—not an objective valuation.
Market Profile usually uses time-price opportunities, or TPOs, rather than volume. Each marker records that price visited a level during a defined time bracket. Its POC and value area therefore reflect TPO concentration, not necessarily the highest traded volume. The two profiles can look similar but answer different questions.
How to build and read a profile on a real chart
Start by deciding which trading period matters to your question. A session profile describes one session. A fixed-range profile covers a selected move or consolidation. A composite combines multiple sessions to reveal broader areas of acceptance.
A visible-range profile changes as you zoom or scroll. That is useful for exploration, but it can quietly move your reference levels. Keep the range consistent when comparing observations.
For stocks, check whether your chart includes extended-hours trading and what volume coverage your feed provides. For indices, distinguish the calculated cash index from a tradable product. A cash index does not itself trade shares or contracts; an associated futures contract or ETF has its own volume and profile.
Next, mark the prior session’s POC, value area boundaries, and prominent nodes. Watch how current price behaves around them:
- Returning to an HVN may lead to slower, two-way trading.
- Crossing an LVN may produce faster movement toward another busy area.
- Approaching the previous POC may trigger a struggle, but price can also pass through without much resistance.
These are tendencies to investigate, not rules. A developing profile changes as trades accumulate, and a developing POC can migrate.
A worked example: leaving value and testing acceptance
Imagine an index futures market that spent the previous session rotating within a clear value area. Its POC sits inside a broad high-volume node, with a thinner region above value.
The next session opens inside the previous value area. Price moves toward the prior POC and repeatedly trades across it. That suggests the market is still doing business around an established reference rather than decisively leaving it behind.
Later, price breaks above the prior value area high and enters the low-volume region. It moves through that region quickly. This fits the idea that relatively little previous business occurred there, but does not prove that the move will continue.
Now compare two possible developments.
In the first, price holds above the old value area, trades repeatedly at higher levels, and builds a new volume bulge. The developing value area shifts upward. This is evidence of acceptance at higher prices, though it remains reversible.
In the second, price briefly trades higher, then falls back inside the old value area. Subsequent activity concentrates around the earlier HVN. The attempted move has not established lasting acceptance.
The lesson is not “buy every break” or “fade every return.” It is to observe whether activity builds beyond a boundary or returns to established value. Neither outcome supplies an automatic entry, stop, or target.
What profiles reveal about order flow and institutional activity
Every completed trade has both a buyer and a seller. A large profile bar tells you that substantial business occurred, not which side will control the next move.
Professional traders use profiles to investigate where large participants may have transacted, accumulated positions, or become trapped. However, the profile alone cannot identify institutions, their intentions, or their remaining positions. High activity is visible; participant identity usually is not.
Order flow adds a different layer. Tools such as footprint charts and bid/ask delta examine executed trading in greater detail, often classifying activity by the aggressing side. They may help assess how price responds when aggressive buying or selling appears at a profile boundary.
Even then, heavy buying without further price progress does not prove that a reversal is coming. Profiles provide location; order flow provides additional evidence about interaction at that location. Neither removes uncertainty.
Common mistakes that make profiles misleading
Treating every level as a precise barrier. Profile rows often group nearby prices. Think in zones, especially when changing row size alters the apparent POC or node structure.
Confusing historical activity with current liquidity. Volume Profile records completed trades. It does not show how many resting orders are available now. A past HVN can attract trading, but it need not stop a strong move.
Assuming price must return to the POC. The “gravity” metaphor can help explain rotation around accepted value, but there is no obligation to revisit it. New information can establish value elsewhere.
Ignoring the selected sample. Different session settings, feeds, ranges, and value-area calculations can produce different results. Check settings before comparing charts.
Using profiles as a timing signal. They cannot tell you when price will reach a level—or whether it will reach it at all. A profile maps where interest was concentrated, not what must happen next.
A short practice checklist
Use the Trade Feeld Terminal to examine chart context and practice these observations with the profile tools available in your setup:
- Identify the instrument, volume source, and session boundaries.
- Choose a consistent profile range and record its settings.
- Mark the POC, value area boundaries, and major nodes.
- Describe whether price is inside value, testing its edge, or trading outside it.
- Watch for sustained activity beyond a boundary rather than relying on one candle.
- Save the chart and review what changed, including observations that contradicted your expectation.
If you want to learn trading free, prioritize repeatable practice. The best website to learn trading should explain data limitations; the best trading coach should help you question a setup rather than promise certainty.
Continue learning with Trade Feeld, @tradefeeld on X, @akylles on X, @tradicators on X, Instagram, YouTube, and LinkedIn.
This material is educational, not financial advice. Profiles are most useful as structured maps for observation—not instructions to trade.
Frequently asked questions
Sources & further reading
Educational content only, not financial advice. Trading involves risk of loss.
Trade these setups live
Get the same signals our research desk uses — entries, stops, and targets in real time.
Gain instant accessKeep reading
Secret AI Trading Technical Indicators: What Pros Actually Use
Discover if there's such thing as a 'secret' AI indicator and how professional traders actually use machine learning in their technical analysis.
Best Trading Indicators for Gold
Learn which technical indicators work best for trading Gold, focusing on its unique volatility and relationship with the dollar.
Comments(0)
Discuss the article and share your tips.