Learn Trading Free: An Honest 90-Day Roadmap
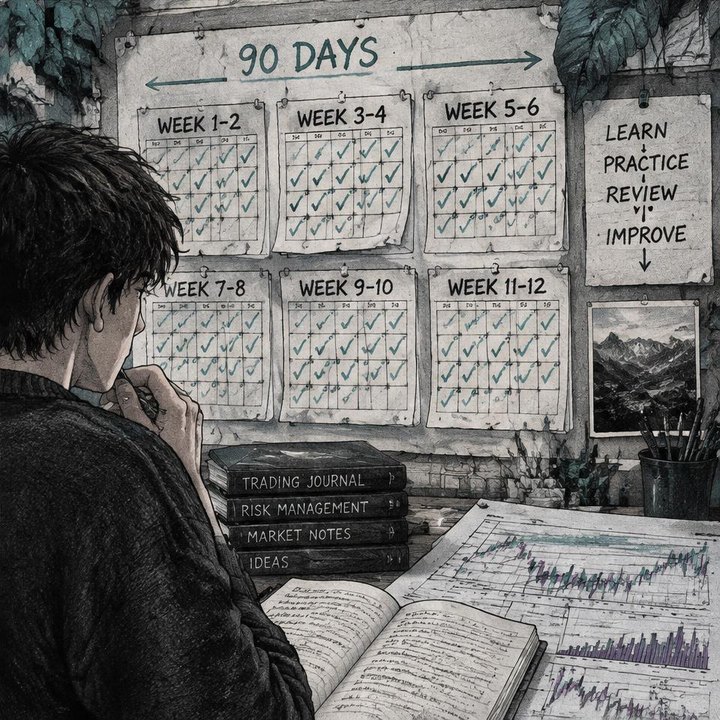
You can learn trading free by following a structured 90-day roadmap: understand market mechanics, study price structure, test one setup, then practise risk control. This trading education plan helps beginners replace scattered videos and indicator downloads with observable skills. It does not promise profitability or require live trading. The aim is to discover whether you can follow a repeatable process before putting real capital at risk.
What learning trading free actually means
Search for trading lessons and you will encounter expensive courses promising extraordinary income alongside channels promoting the latest “Free AI Indicator” without a verifiable track record. Neither a high price nor a free download proves educational value.
The alternative is slower: learn a concept, observe it on a chart, practise it in simulation, and record what happened. This is the roadmap we recommend to beginners joining the Trade Feeld community.
The learning path can be free, but live trading is not. Spreads, commissions, financing charges, and losses can matter. Some platforms also charge for data or restrict simulator features.
The best website to learn trading is one that explains mechanics and risk clearly, not one that makes the biggest promises. Use a structured resource such as the free trading course, alongside your platform’s documentation. Education should help you become less dependent on someone else’s calls.
Days 1–14: Learn the mechanics before reading signals
Your first goal is to understand what you are trading and how orders work. Pick one market to study. Learn its trading hours, minimum order size, and whether leverage or overnight costs apply.
Be able to explain these order types:
- Market: seeks immediate execution at available prices, not a guaranteed price.
- Limit: sets your worst acceptable execution price but may never fill.
- Stop: usually triggers a market order when a specified price is reached; execution can be worse than expected.
- Stop-limit: triggers a limit order, which may remain unfilled during a fast move.
- Post-only: where supported, adds liquidity rather than immediately matching an existing order; platform rules determine rejection or cancellation.
Open a paper-trading account and place 20 orders of each supported type. Observe fills, cancellations, and unfilled orders. Do not confuse simulated execution with proof that a live order would behave identically.
Next, learn candlesticks. Each candle shows the open, high, low, and close for its interval. Volume is usually displayed separately and reflects the activity captured by that data feed.
Skip indicators during these two weeks. Watch price and volume, and explain what happened without predicting what comes next.
Days 15–30: Read structure on a real chart
Your next goal is to describe market structure consistently, rather than claim you can see hidden intentions.
A swing high is a local peak; a swing low is a local trough. An uptrend generally forms higher highs and higher lows. A downtrend generally forms lower highs and lower lows. A range moves between areas where advances and declines have repeatedly stalled.
Mark up 50 charts by hand. Identify support and resistance as areas, not perfectly precise barriers. Price can briefly cross a level and return, or move through it without stopping.
On a real chart, start with completed candles. Mark the most recent clear swings, then ask whether price is progressing in one direction or overlapping inside a range. Keep the chart timeframe consistent while learning.
Add one indicator: a 20-period moving average. It summarises recent prices and therefore lags them. Notice whether price stays mostly above it, below it, or repeatedly crosses it. None of those observations alone is an entry signal.
Journal what you see: “Price returned to the prior swing low” is an observation. “Buyers will defend it” is a prediction.
Days 31–60: Build one setup and work through an example
Choose one approach: a trend pullback to a moving average, a range reversal, or a breakout retest. Trading for beginners becomes more manageable when the question is narrow enough to test.
Write down the market, timeframe, qualifying conditions, entry trigger, stop placement, target, and reasons to skip. Avoid rules such as “enter when it looks strong.”
Consider a breakout-retest example. Price breaks above the prior day’s high, then returns to that area. Your written rule requires a completed candle to close back above the level before an entry is considered. A touch alone does not qualify.
For this example, the stop belongs below the retest’s low, where the setup would be invalidated. The target is a previously marked resistance area. If that area offers insufficient potential reward relative to the stop distance under your rules, skip the trade.
Before placing a simulated order, calculate position size from the planned cash risk and entry-to-stop distance, including the instrument’s value per price increment. Account for estimated costs. A stop limits intended risk, but gaps and slippage can make actual losses larger.
Paper-trade 100 qualifying setups and log every one, including losers. If enough opportunities do not occur, extend the schedule rather than manufacture trades.
Track:
- Win rate: winning trades divided by all completed trades.
- R result: the outcome expressed relative to the initial planned risk.
- Average R: total R results divided by completed trades.
- Expectancy: win rate multiplied by average win, minus loss rate multiplied by average loss, using consistent units and accounting for costs.
A positive sample is not proof of a durable edge. It is a baseline for further testing.
Days 61–90: Practise risk control and avoid common mistakes
Risk discipline is essential, but it cannot turn a losing strategy into a profitable one by itself.
Make 1R familiar: it is the amount you planned to risk on a trade, not the amount invested. Define daily and weekly loss limits, plus an account drawdown limit measured from a prior account peak. Write down what happens when each is reached.
The original live-practice exercise is 50 small trades at 0.25% planned account risk each. Treat that as an optional educational illustration, not a requirement or a declaration of safety. Stay in simulation if results, finances, or execution skills do not justify live exposure. Never force trades to meet the calendar.
Common mistakes include:
- Changing rules after one loss. Review weekly; wait for 30 or more trades before considering strategic changes, while recognising that even this sample may be inconclusive.
- Shopping for the best trading indicators. Extra indicators often repeat information rather than improve decisions.
- Trusting AI trading tools without comparison. Test them against your baseline and check whether historical signals change after the fact.
- Seeking the best trading coach by profit screenshots. Look for clear teaching, transparent limitations, and no pressure to deposit or buy signals.
Real money can feel very different from paper trading. Journal hesitation, impulsive entries, and rule violations separately from strategy outcomes.
Your practice checklist and the decision after 90 days
Before moving forward, check that you can:
- Explain order behaviour and trading costs.
- Mark structure without hindsight.
- Follow one written setup.
- Calculate position size and record results in R.
- Respect loss limits and review your journal weekly.
After 90 days, you may decide trading is not for you. That is a useful outcome, not a failure.
If you continue, evaluate Trade Feeld signals or other professional tools against your own framework rather than treating them as gospel. Ask how win rates are calculated, whether losses are included, and what to do when the model is silent.
Learning can be free. Competence takes patience, and profitability remains uncertain. This roadmap is education, not financial advice.
Follow Trade Feeld
Educational content only, not financial advice. Trading involves risk of loss.
Trade these setups live
Get the same signals our research desk uses — entries, stops, and targets in real time.
Gain instant accessKeep reading
Start Trading from 0: The Complete First-Week Plan
Learn how to start trading from scratch with this structured 7-day action plan covering platforms, charts, and your first demo trades.
Trading from 0 to Hero: The Realistic Roadmap
Discover the stages of a trader's evolution, from the initial 'unconscious incompetence' to becoming a consistently profitable market participant.
Comments(0)
Discuss the article and share your tips.